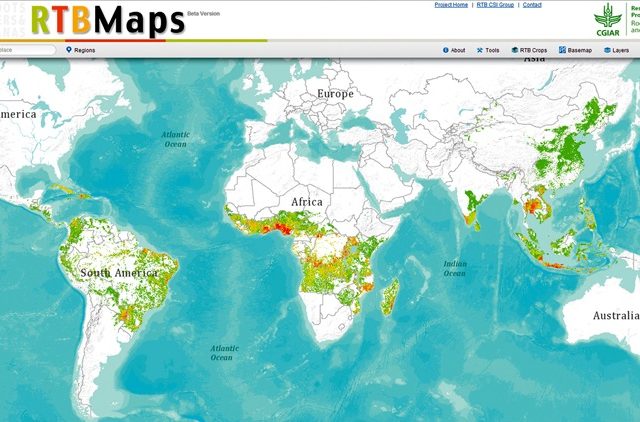
Through an interactive mapping system, scientists and agricultural professionals can now visualize the world of roots, tubers and bananas. Using 25 categories, RTBMaps paints a complex picture of global production zones.
With the click of a mouse, users may create a specialized map that compares plantain harvest zones to mean temperature, cassava to mealybug presence, or potatoes to food accessibility.
Publisher: FreshFruitPortal.com
Publishing date: 2013-07-19