By Glenn Hyman – International Center for Tropical Agriculture (CIAT)
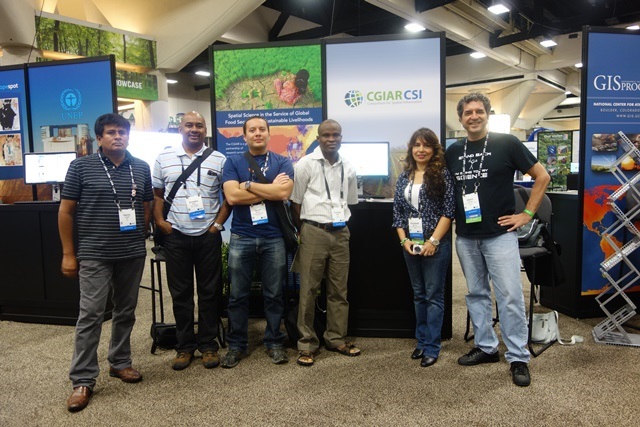
Far too often our research and development activities remain hidden in difficult-to-find places, limiting its potential to achieve impact. A group of seven professionals applying spatial analysis and geographic information systems (GIS) to roots, tubers and bananas (RTB) research is working to change that. They met last week in San Diego, California in conjunction with the Environmental Systems Research Institute’s (ESRI) International Users Conference to share results of their work on RTB crops. The meeting was sponsored by the RTB Research Program and the Consortium for Spatial Information (CSI), both CGIAR initiatives.
The researchers – a RTB team of GIS professionals – presented their research on mapping soil organic carbon in cassava fields, participatory research for biodiversity monitoring of potato, use of GIS for assessing banana fusariam wilt disease, a multi-criteria decision support system for priority setting in RTB crops, an open database of evaluations trials and an online digital atlas called RTBMaps (see summaries and links to the research presentations below). One aim of the group is to share useful geographic information developed by RTB researchers with the larger agricultural research community. They share this knowledge through RTBMaps.
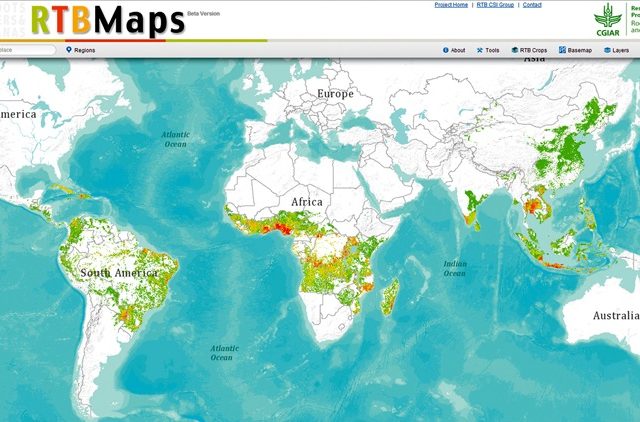
RTBMaps brings together spatial information on RTB crop distributions, abiotic and biotic constraints to RTB production, socioeconomic conditions and other map information relevant to these crops. The group puts this information in the public domain for use by the research and development community working on RTB crops. Future development of the Atlas will include new map layers on pests and diseases, climate change impacts on RTB crops and other layers of interest. Ultimately the group expects to motivate new research and development activities that build on these knowledge and information resources.
Online Atlas of Roots, Tubers and Banana Crops
RTBMaps is an online GIS tool to visualize production, constraints and social indicators associated with Roots and Tubers and Bananas (RTB) crops. Information mapped by the tool, includes data on pests and diseases, evapotranspiration rates, vulnerability to failed harvests, fertilizer application rates and the incidence of malnutrition in children. With this project the power of maps will be out of the GIS lab into the hands of the RTB science community-CGIAR scientists and partners worldwide.
Spatial Variability of Soil Organic Carbon in a Cassava Farm Nigeria
Spatial variability map of Soil Organic Carbon (SOC) is crucial for nutrient management. Georeferenced samples were collected at 30 and 60cm depth on 467Ha. Kriging produced spatial distribution of SOC using Geostatistical Analyst. Best fit semivariogram models were Rational Quadratic(topsoil) and K-Bessel(subsoil). The nugget-to-sill ratio was 0.60 (topsoil) and 0.92(subsoil), indicating medium & weak spatial dependence for both depths. Two fertility management zones for SOC were delineated
Participatory mapping for the systematic monitoring of biodiversity
Biodiversity sustains a wide variety of genetic traits that are very valuable for the potato’s adaption to changing environments and successful cultivation in the future. However, several factors are threatening biodiversity in the Andes. For this reason, it is necessary for monitoring to be done with a standardized system and common observation parameters. Here we explain how participatory mapping and survey methods are used for the systematic monitoring of potato landraces in the Andes.
Geographic Targeting for Diagnostic of Banana Fusarium Wilt
Using ArcGIS Desktop we applied different criteria to select a group a 149 farms to conduct the first stage of a study in San Luis de Shuaro, Peru. Due to access difficulties found on this region, the study would have been much more difficult and cost much more in terms of resource allocation had we been unable to utilize GIS.
Siempre: A GIS aided multi-criteria decision analysis application
GIS tools allow the handling of spatial criteria data to be assimilated and interpreted by groups of experts when evaluating solutions to complex problems.This project uses multicriteria decision analysis to support geographic targeting of interventions in crop improvement for main agricultural crops, by using an application called SIEMPRE, which is GIS aided online, and is used to elicit expert opinion to value alternative solutions utilizing the Analytical Hierarchy Process (AHP) methodology.
A global agricultural trial site application
This presentation describes an application that organizes and manages evaluations of crop cultivars at sites across the world. The application can serve this data and includes multiple opportunities for linking systems that deal with these types of data. In the presentation, we demonstrate the development of an online database to manage evaluation data, linking this data set to geographic representations online and providing the data as a service to other applications.