bananalogo
flagFrançais (French)flagEspañol (Spanish)
flagEnglish
  • Home
  • About
  • Knowledge Toolkit
  • Survey
  • Contacts

3.2. Poverty effects model

Home Knowledge toolkit 3. Methodology for assessment 3.2. Poverty effects model

WHY POVERTY EFFECTS MODEL?

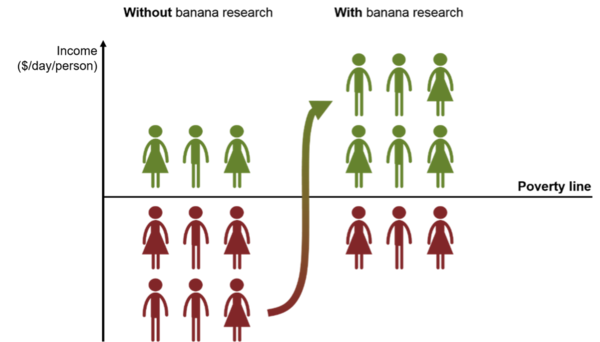
A crucial component of this priority assessment exercise is to calculate how many people can actually be lifted out of poverty through adoption of new technologies, for example higher yielding banana varieties, from research investments. Considering poverty effects as an additional indicator complements the traditional economic indicators of Net Present Value and Internal Rate of Return. This can result in a different ranking of research options and helps to better direct funds to areas where the largest benefits arise to the target group of RTB research, i.e. the poor depending on RTB crops for income and livelihoods.

HOW DOES IT WORK?

The methodology for predicting poverty reduction is based on the estimated growth in the agricultural sector of a given country. To this end, the benefit estimates generated by the surplus model are interpreted as agricultural growth.

The following inputs are needed to set up the poverty model:

  • change in economic surplus (producer and consumer surplus) due to banana research
  •  relative value of total agricultural production, measured as share of total Gross Domestic Product (GDP)
  •  total number of poor, measured as national population living below $1.25 per day
  •  region‐specific elasticity of poverty reduction with respect to agricultural growth, which is the percentage change in the incidence of poverty brought about by a 1% growth in the agricultural sector.

If we divide the change in economic surplus due to banana research by the agricultural GDP and multiply this by 100%, we receive the annual gains from research as a percentage of agricultural GDP. Multiplying this value by the region-specific elasticity of poverty equals the poverty reduction per year as a percentage of the poor. If we further multiply this by the total number of poor – calculated from the total national population and the country-specific poverty level – we receive the number of poor lifted out of poverty annually as a result of the research investment. The region-specific elasticity is higher for Sub-Saharan Africa than for Asia and lowest for Latin America and the Caribbean. Thus, research options with a larger share of adoption expected in Sub-Saharan Africa (for example, breeding for resistant East African Highland banana varieties) can rank higher using this performance indicator than those with a large share of adoption in Latin America and Caribbean (for example, breeding for resistant plantain varieties).

Knowledge toolkit

  • 1. Identification of major constraints and opportunities
    • 1.1. Summary of expert survey process
    • 1.2. Kampala workshop outcome
  • 2. Formulation of research options
  • 3. Methodology for assessment
    • 3.1. Cost-Benefit Analysis
    • 3.2. Poverty effects model
    • 3.3. Estimation of the number of potential beneficiares
  • 4. Elicitation process and information sources
  • 5. Parameter estimates and underlying assumptions
  • 6. Results
  • 7. Limitations and lessons learned
  • 8. Survey
file_downloadDownload full Report
                             
This work is licensed under a Creative Commons Attribution-NonCommercial-NoDerivatives 4.0 International License.